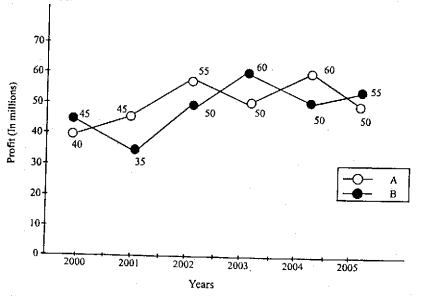
1) Firm A spent 35,00,000 in the year 2002. What is the income of Firm A in that year?
(A) 15,42,500
(B) 20,00,000
(C) 15,25,000
(D) 90,00,000
2) If the expenditure of both the firms A and B in the year 2004 was equivalent, then what was the ratio between the income of Firm A to Firm B?
(A) 15 : 6
(B) 6 : 15
(C) 6 : 5
(D) 16 : 5
3) In which of the following years was the maximum percentage of growth/decline with respect to the previous years in case of Company B?
(A) 2000 - 2001
(B) 2001 - 2002
(C) 2002 - 2003
(D) 2003 - 2004